
Just a short update on August 24th 2026
Despite being borderline fishing fanatics, we chose conservation of our coho stocks becuas4e the DFO does not care about them. The numbers could well be the worst in recorded history, so their solution was to hid recorded history. We have come to the conclusion the DFP no longer are there to protect the salmon or steelhead stocks. What we are seeing is an intent to give all the fish off our coast, in our rivers and in collusion with the Provincial Fish and Wildlife, give Indians full control and ownership of it all.
We wanted to share with you all the facts that seem now to be hidden by the DFO, who said they moved their information to Skeena Knowledge Trust and seem to be getting most of their information from a SkeenaWild Tides funded environmentalist groups, strongly tied to giving all our resources to the Indians.
The records they are hiding are the salmon counts from 1955 to 2011 below are the originals both the DFO and Skeena Knowledge Trust are withholding from the public. Save a copy of each, in case this website is no longer available.
Large-Chinook-Skeena-Tyee-Testfish-Historic-Index-Report.xlsx
Large-Sockeye-Skeena-Tyee-Testfish-Historic-Index-Report.xlsx
Coho-Skeena-Tyee-Testfish-Historic-Index-Report.xlsx
Pink-Skeena-Tyee-Testfish-Historic-Index-Report.xlsx
Chum-Skeena-Tyee-Testfish-Historic-Index-Report.xlsx
Steelhead.xls
Obviously we cannot trust Skeena Knowledge Trust with these very important documents.

Do the math, Chook should have been open and Coho should be closed, its the worst runs in recorded history, feel free to correct me if I am wrong. Steelhead are doing great, but now we don’t even know if all the numbers are fabricated this year due to more than hall a million sockeye that simply vanished from our rivers.
The page blow this point was originally created in 2021, keep that in mind when reading it.
As you can see from the numbers (below), yes we had a bad year (last year) and we may have another bad year this year 2021) but its a far cry from the alarms being set off by eco-maniacs who have a political agenda. Yes we need to save our salmon, using facts, and those facts show that we have had worse runs in the past and some of the best runs ever followed in the years afterwards. For Chinook, look at the 60’s and 70’s then look at the comeback in the 1990’s and 2000’s.
Lets get the politics, unions and eco-maniacs out of fishing, and lets protect what we have without the hysteria based on real numbers and real science, not that horse manure pedalled by environmentalists. We posted the numbers, now just do your own math after checking this years numbers.
For those of you who enjoy facts and figures, we posted some historical fishcounts for comparison to today’s numbers. We will not be producing weekly graphs of those numbers as it involves more time and effort than I really have to spare. The numbers I will share are very relevant and oddly no longer available from the DFO. I do not know why, either they think those numbers are no longer of value to the public, or they simply do not want the public to know the historical background numbers of salmon and steelhead.
We do have all of the numbers that we were able to get 1956-2012 while they still shared them. As the numbers were daily, and every year, there is far more numbers than that we intend to publish. What we will do is take all of the “decade averages” one set for July 1st and the other on the last completed average, that being Aug 24th where there was a reading taken every day across the years.
This will give you and approximate mid season comparison, and a seasonal comparison against the years now posted on the DFO website.
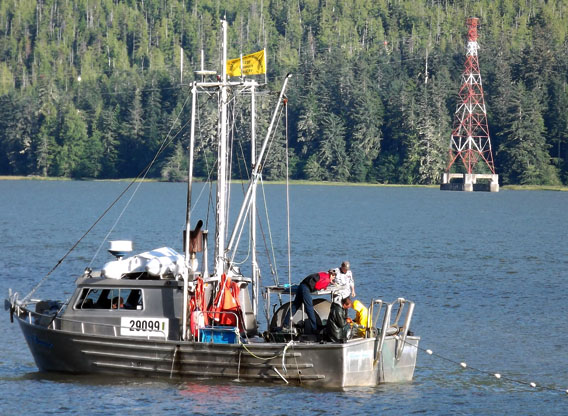
You can check the daily numbers of each species from 2011 to current at this link Skeena Tyee Test Fishery
In a nutshell below will be one on each (decade average) date from 1956 to 2019, one set for July 1st the other for August 24th, you can compare this to the results you can get on the above posted link.
How to use the graphs below.
In a separate browser, open this link and compare the numbers to what the DFO is publishing in the Daily Tyee Count
Chinook Salmon


Sockeye Salmon
Note: The magic number set by the DFO in the past has been the 800,000 threshold needed to allow recreational fishing.


Pink Salmon
NOTE: The July 1st count will not work here as almost every year except a few the number was zero, as in too early to count, so we will only do the Aug 24th count.

Coho Salmon
NOTE: The July 1st count will not work here as almost every year except a few the number was zero, as in too early to count, so we will only do the Aug 24th count.

Chum Salmon
NOTE: The July 1st count will not work here as almost every year except a few the number was zero, as in too early to count, so we will only do the Aug 24th count.

Steelhead
NOTE: The July 1st count will not work here as almost every year except a few the number was zero, as in too early to count, so we will only do the Aug 24th count.
